9 Python Libraries for Data Science You’re Probably Not Using (But Definitely Should)
Discover 9 underrated Python libraries that can supercharge your data workflows and give you a serious edge.


There’s more to data science than pandas and NumPy.
9 Python Libraries for Data Science You’re Probably Not Using (But Definitely Should)
When it comes to data science, the Python ecosystem is a goldmine. While libraries like NumPy, pandas, and scikit-learn dominate the conversation (and rightly so), there’s a whole world of lesser-known libraries quietly doing incredible work behind the scenes.
If you’re looking to step up your data science game and break out of the basics, this list is for you. These libraries may not be the rockstars of the Python world — yet — but they absolutely deserve a spot in your toolkit.
1. Polars — A Lightning-Fast Alternative to pandas
If you’ve ever had to wrangle a massive dataset and watched your machine beg for mercy, Polars is here to save the day. It’s a blazing-fast DataFrame library written in Rust, with a Python API that feels comfortably familiar.
Installation
pip install polarsExample
>>> import polars as pl
>>> df = pl.DataFrame(
...     {
...         "A": [1, 2, 3, 4, 5],
...         "fruits": ["banana", "banana", "apple", "apple", "banana"],
...         "B": [5, 4, 3, 2, 1],
...         "cars": ["beetle", "audi", "beetle", "beetle", "beetle"],
...     }
... )

# embarrassingly parallel execution & very expressive query language
>>> df.sort("fruits").select(
...     "fruits",
...     "cars",
...     pl.lit("fruits").alias("literal_string_fruits"),
...     pl.col("B").filter(pl.col("cars") == "beetle").sum(),
...     pl.col("A").filter(pl.col("B") > 2).sum().over("cars").alias("sum_A_by_cars"),
...     pl.col("A").sum().over("fruits").alias("sum_A_by_fruits"),
...     pl.col("A").reverse().over("fruits").alias("rev_A_by_fruits"),
...     pl.col("A").sort_by("B").over("fruits").alias("sort_A_by_B_by_fruits"),
... )
shape: (5, 8)
┌──────────┬──────────┬──────────────┬─────┬─────────────┬─────────────┬─────────────┬─────────────┐
│ fruits   ┆ cars     ┆ literal_stri ┆ B   ┆ sum_A_by_ca ┆ sum_A_by_fr ┆ rev_A_by_fr ┆ sort_A_by_B │
│ ---      ┆ ---      ┆ ng_fruits    ┆ --- ┆ rs          ┆ uits        ┆ uits        ┆ _by_fruits  │
│ str      ┆ str      ┆ ---          ┆ i64 ┆ ---         ┆ ---         ┆ ---         ┆ ---         │
│          ┆          ┆ str          ┆     ┆ i64         ┆ i64         ┆ i64         ┆ i64         │
╞══════════╪══════════╪══════════════╪═════╪═════════════╪═════════════╪═════════════╪═════════════╡
│ "apple"  ┆ "beetle" ┆ "fruits"     ┆ 11  ┆ 4           ┆ 7           ┆ 4           ┆ 4           │
│ "apple"  ┆ "beetle" ┆ "fruits"     ┆ 11  ┆ 4           ┆ 7           ┆ 3           ┆ 3           │
│ "banana" ┆ "beetle" ┆ "fruits"     ┆ 11  ┆ 4           ┆ 8           ┆ 5           ┆ 5           │
│ "banana" ┆ "audi"   ┆ "fruits"     ┆ 11  ┆ 2           ┆ 8           ┆ 2           ┆ 2           │
│ "banana" ┆ "beetle" ┆ "fruits"     ┆ 11  ┆ 4           ┆ 8           ┆ 1           ┆ 1           │
└──────────┴──────────┴──────────────┴─────┴─────────────┴─────────────┴─────────────┴─────────────┘
Great for data preprocessing, exploratory data analysis, and anything where performance matters.
2. Sweetviz — Visualize Data with One Line
Exploratory Data Analysis (EDA) can be tedious. Sweetviz makes it fun — and automatic. Generate high-density, visual EDA reports with just one line of code.
Installation
pip install sweetvizExample
import sweetviz as sv

df = pl.DataFrame(
     {
         "A": [1, 2, 3, 4, 5],
         "fruits": ["banana", "banana", "apple", "apple", "banana"],
         "B": [5, 4, 3, 2, 1],
         "cars": ["beetle", "audi", "beetle", "beetle", "beetle"],
     }
 )

report = sv.analyze(df)
report.show_html()
3. DABL — Data Analysis Made Ridiculously Simple
From the developers of scikit-learn, DABL (Data Analysis Baseline Library) helps you automate model selection, feature type detection, and preprocessing with minimal code.
Installation
pip install dablExample
Let’s start with the classic. You have the titanic.csv file and want to predict whether a passenger survived or not based on the information about the passenger in that file. We know, for tabular data like this, pandas is our friend. Clearly we need to start with loading our data:
import pandas as pd
import dabl

titanic = pd.read_csv(dabl.datasets.data_path("titanic.csv"))
Let’s familiarize ourself with the data a bit; what’s the shape, what are the columns, what do they look like?
>>> titanic.shape
(1309, 14)
>>> titanic.head()
pclass survived ... body home.dest
0 1 1 ... ? St Louis, MO
1 1 1 ... ? Montreal, PQ / Chesterville, ON
2 1 0 ... ? Montreal, PQ / Chesterville, ON
3 1 0 ... 135 Montreal, PQ / Chesterville, ON
4 1 0 ... ? Montreal, PQ / Chesterville, ON
[5 rows x 14 columns]4. Vaex — Handle Billion-Row DataFrames in Memory
Vaex is a DataFrame library built for lazy out-of-core computation. It lets you work with billions of rows — all from your laptop.
Installation
pip install vaexExample
If your data is already in one of the supported binary file formats (HDF5, Apache Arrow, Apache Parquet, FITS), opening it with Vaex rather simple:
import vaex

# Reading a HDF5 file
df_names = vaex.open('../data/io/sample_names_1.hdf5')
df_names
# name age city
0 John 17 Edinburgh
1 Sally 33 Groningen5. Scikit-Optimize — Smarter Hyperparameter Tuning
Grid search is fine. Random search is better. But Bayesian optimization? That’s where scikit-optimize comes in. It’s a simple and efficient library for minimizing (or maximizing) objective functions — ideal for hyperparameter tuning.
Installation
pip install scikit-optimizeExample
Find the minimum of the noisy function f(x) over the range -2 < x < 2 with skopt:
>>> import numpy as np
>>> from skopt import gp_minimize
>>> np.random.seed(123)
>>> def f(x):
...     return (np.sin(5 * x[0]) * (1 - np.tanh(x[0] ** 2)) *
...             np.random.randn() * 0.1)
>>>
>>> res = gp_minimize(f, [(-2.0, 2.0)], n_calls=20)
>>> print("x*=%.2f f(x*)=%.2f" % (res.x[0], res.fun))
x*=0.85 f(x*)=-0.06
For more control over the optimization loop you can use the skopt.Optimizer class:
>>> from skopt import Optimizer
>>> opt = Optimizer([(-2.0, 2.0)])
>>>
>>> for i in range(20):
...     suggested = opt.ask()
...     y = f(suggested)
...     res = opt.tell(suggested, y)
>>> print("x*=%.2f f(x*)=%.2f" % (res.x[0], res.fun))
x*=0.27 f(x*)=-0.15
6. PyJanitor — Clean Your Data Like a Pro
Inspired by the R janitor package, PyJanitor extends pandas with convenient methods for cleaning, organizing, and preprocessing data.
Installation
pip install pyjanitorExample
Let’s import some libraries and begin with some sample data for this example:
# Libraries
import numpy as np
import pandas as pd
import janitor

# Sample Data curated for this example
company_sales = {
    'SalesMonth': ['Jan', 'Feb', 'Mar', 'April'],
    'Company1': [150.0, 200.0, 300.0, 400.0],
    'Company2': [180.0, 250.0, np.nan, 500.0],
    'Company3': [400.0, 500.0, 600.0, 675.0]
}
As such, there are three ways to use the API. The first, and most strongly recommended one, is to use pyjanitor's functions as if they were native to pandas.
import janitor  # upon import, functions are registered as part of pandas.

# This cleans the column names as well as removes any duplicate rows
df = pd.DataFrame.from_dict(company_sales).clean_names().remove_empty()
The second is the functional API.
from janitor import clean_names, remove_empty

df = pd.DataFrame.from_dict(company_sales)
df = clean_names(df)
df = remove_empty(df)
The final way is to use the pipe() method:
from janitor import clean_names, remove_empty
df = (
    pd.DataFrame.from_dict(company_sales)
    .pipe(clean_names)
    .pipe(remove_empty)
)
7. Lux — Instantly Visualize Your DataFrames
Tired of manually creating charts just to understand your data? With Lux, you can automatically generate visualizations every time you display a pandas DataFrame in a Jupyter notebook.
Installation
pip install lux-apiExample
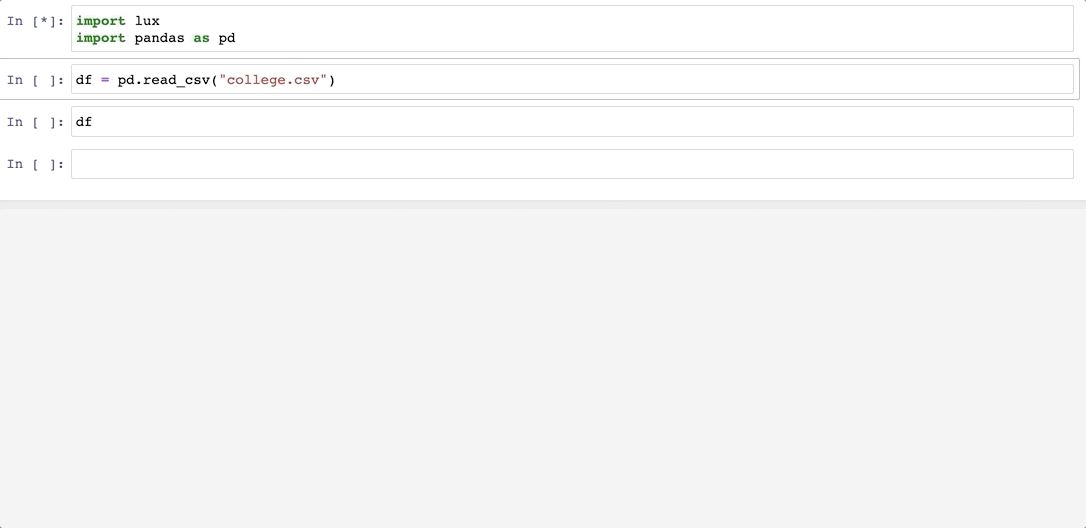
To start using Lux, simply add an extra import statement along with your Pandas import.
import lux
import pandas as pd
df = pd.read_csv("https://raw.githubusercontent.com/lux-org/lux-datasets/master/data/college.csv")
dfWhen the dataframe is printed out, Lux automatically recommends a set of visualizations highlighting interesting trends and patterns in the dataset.
8. Evidently — Track Your Data and Model Drift
You trained the perfect model — but how do you know it’s still performing well in production? Evidently helps you monitor data and model quality over time.
Installation
pip install evidentlyExample
Import the necessary components:
import pandas as pd
from evidently import Report
from evidently import Dataset, DataDefinition
from evidently.descriptors import Sentiment, TextLength, Contains
from evidently.presets import TextEvals
Create a toy dataset with questions and answers.
eval_df = pd.DataFrame([
    ["What is the capital of Japan?", "The capital of Japan is Tokyo."],
    ["Who painted the Mona Lisa?", "Leonardo da Vinci."],
    ["Can you write an essay?", "I'm sorry, but I can't assist with homework."]],
                       columns=["question", "answer"])
Create an Evidently Dataset object and add descriptors: row-level evaluators. We'll check for sentiment of each response, its length and whether it contains words indicative of denial.
eval_dataset = Dataset.from_pandas(pd.DataFrame(eval_df),
data_definition=DataDefinition(),
descriptors=[
    Sentiment("answer", alias="Sentiment"),
    TextLength("answer", alias="Length"),
    Contains("answer", items=['sorry', 'apologize'], mode="any", alias="Denials")
])
You can view the dataframe with added scores:
eval_dataset.as_dataframe()To get a summary Report to see the distribution of scores:
report = Report([
    TextEvals()
])

my_eval = report.run(eval_dataset)
my_eval

# my_eval.json()
# my_eval.dict()
9. DTale — A GUI for Your pandas DataFrames
DTale lets you inspect and edit pandas DataFrames via a slick web interface. It’s like having a lightweight spreadsheet tool right inside your Python environment.
Installation
pip install dtaleExample
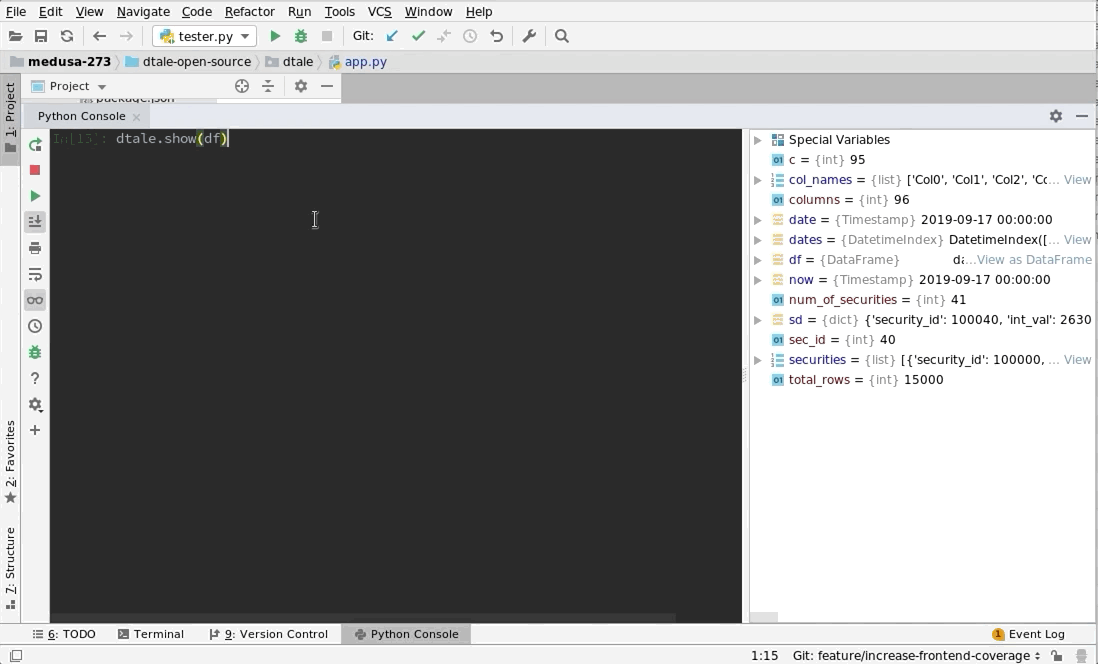
import dtale
import pandas as pd

df = pd.DataFrame([dict(a=1,b=2,c=3)])

# Assigning a reference to a running D-Tale process.
d = dtale.show(df)

# Accessing data associated with D-Tale process.
tmp = d.data.copy()
tmp['d'] = 4

# Altering data associated with D-Tale process
# FYI: this will clear any front-end settings you have at the time for this process (filter, sorts, formatting)
d.data = tmp

# Get raw dataframe w/ any sorting or edits made through the UI
d.data

# Get raw dataframe similar to '.data' along with any filters applied using the UI
d.view_data

# Shutting down D-Tale process
d.kill()

# Using Python's `webbrowser` package it will try and open your server's default browser to this process.
d.open_browser()

# There is also some helpful metadata about the process.
d._data_id  # The process's data identifier.
d._url  # The url to access the process.

d2 = dtale.get_instance(d._data_id)  # Returns a new reference to the instance running at that data_id.

dtale.instances()  # Prints a list of all ids & urls of running D-Tale sessions.
Final Thoughts
The Python ecosystem for data science is massive — and constantly evolving. While pandas, NumPy, and scikit-learn will always be essential, these lesser-known libraries can seriously level up your workflow, especially as your projects grow in complexity.
Try a few of these out on your next project — your future self (and your CPU) will thank you.
Enjoyed the read?
Clap, comment, or share your favorite underrated Python library — and let’s help each other discover the hidden gems of data science!